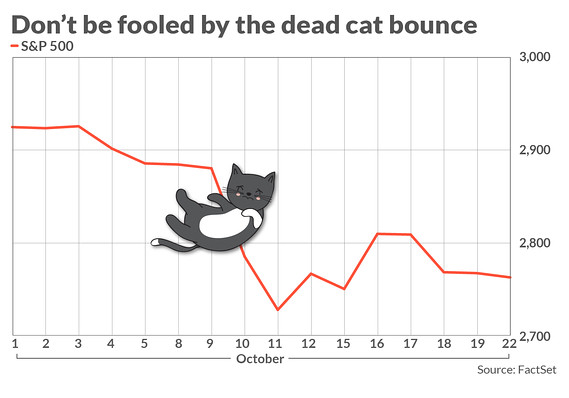
October is living up to its infamous reputation as a volatile month for stocks with major indexes down sharply and there is likely more pain ahead for investors, according to one prominent Wall Street analyst.
The recent rebound “was a dead cat bounce,” said Michael Wilson, an equity strategist at Morgan Stanley, in a report. “We look for confirmation with a definitive break of the S&P 500 through its 200-day moving average.”
After eking out gains last week, the S&P 500 SPX, -0.43% is trading below the 200 DMA of 2,768 Monday as stocks struggle for direction with third-quarter earnings cycle picking up pace. The blue-chip Dow Jones Industrial Average DJIA, -0.50% is also headed south while the Nasdaq COMP, +0.26% alone is higher against its long-term trend line. Market technicians view moving averages as a dividing line of bullish and bearish momentum in an asset.
“We don’t think the correction is done yet. We think attempts to rebound were more short lived than sustainable. Recent price declines in crowded growth, tech, and discretionary have caused enough portfolio pain that we think most investors are playing with weak hands,” he said.
Growth names, a favorite among investors until recently, have come under increasing pressure as the market’s focus shifted to value stocks, while the tech sector, which had outperformed other industries this year, is also beating a hasty retreat.
For instance, growth stocks—those reflecting companies whose profits grow consistently and at faster clip than the overall market—have swapped places with their less favored peers and are lagging value names as measured by popular thematic Russell funds. The Russell 1000 Growth Index RLG, +0.06% has lost 6.7%, compared with a less-severe loss of 4.4% for the Russell 1000 Value Index RLV, -0.91% Value investing typically refers to investing in shares of companies trading below certain intrinsic measure.
And as the bull market’s more popular stocks finally succumb to the rolling bear market, Wilson cast doubt on whether investors will able to count on the so-called Santa rally, a strong surge in stock prices that has become almost a tradition at the end of the year.
“Given the high degree of cyclicality in both tech and consumer discretionary, we think their derating should be more in line with the broader S&P 500, or another 6-8%,” he said.
To be sure, not everyone thinks the light at the end of the tunnel is a train.
JC O’Hara, chief market technician at MKM Partners, believes the bulk of the selling is now in the rearview mirror.
“While the S&P 500 index is just minus 5.5% off the Sept. 20 high, the average S&P 500 stocks is off minus 17% from its 52-week high, thus much selling on the stock level has already taken place,” he wrote in a note. “The fact that the S&P managed to close higher on just 5 of the last 21 trading days, a very rare streak, shows just how much selling has already occurred.”
Among other signs, O’Hara pointed to the National Association of Active Investment Managers’ survey which showed that managers reduced their exposure to equities to 58% last week. Since 2016, a reading in the vicinity of 60% has led to managers adding to their positions.
The key level to watch, by his reckoning, is 2,825.
“A close above 2,825 will nullify the bear case,” he said. “If this pattern indeed plays out for the bears, 2,600 is the downside objective. Often, capitulation lows are retested. The longer the market trades under 2,825 the more likely it is to retest 2,710.”
The contrasting views from the two market observers underscore the conflicting factors driving the market with fears about higher interest rates and unresolved trade friction offset by relatively solid earnings and a robust economy.
As a result, volatility is likely to remain elevated for now as bulls and bears continue to face off for control of the market. The Cboe Volatility Index VIX, +15.07% rose 0.8% to 20.04 Monday. Experts view the VIX below 12 as low and above 20 as high, relative to the gauge’s historical average.