


")


The stock market continues to trend lower.
Before rallying on Friday, the S&P 500 had a closing low of 3,930.08 on Thursday, down 18.1% from its all-time closing high of 4,796.56 on January 3.
If you consider the intraday market action, the S&P traded as low as 3,858.87 on Thursday, down 19.9% from its intraday high of 4,818.62 on January 4.
Technically speaking, stocks don’t enter a “bear market” until prices are down at least 20% from their highs. And for most market watchers, this calculation is based on closing prices. Frankly, this is all silly semantics about round numbers and rounding errors.
Any way you look at it, the stock market is down a lot.

Learning from history
We could debate all of the ways that the present day is and isn’t like history’s bull and bear markets, but that’s unlikely to end with a definitive conclusion.1 Nevertheless, let’s do a quick review of historical market performance.
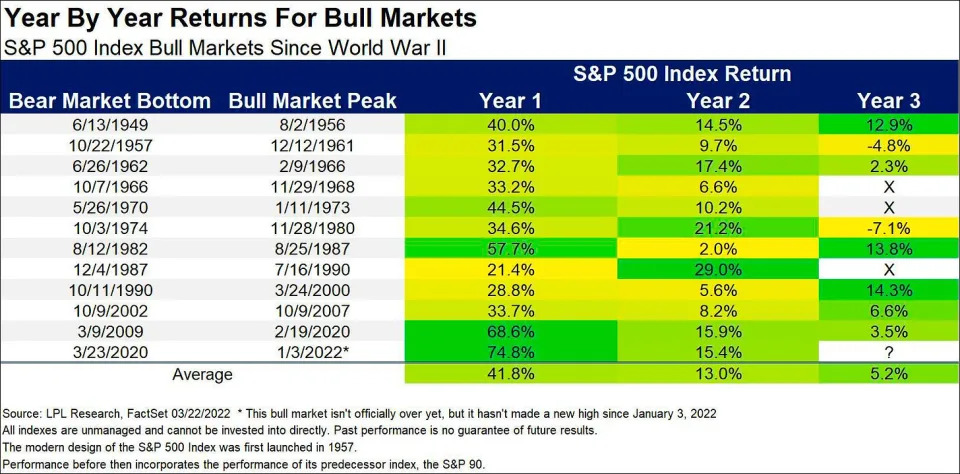
Technically, we’re in year three of a bull market that began on March 23, 2020.
Ryan Detrick, chief market strategist at LPL Financial, reviewed the history and found that three of the 11 bull markets since World War II ended in year three. So from the perspective of duration, it wouldn’t be too unusual for stocks to be in a full-blown bear market some time before March 2023.
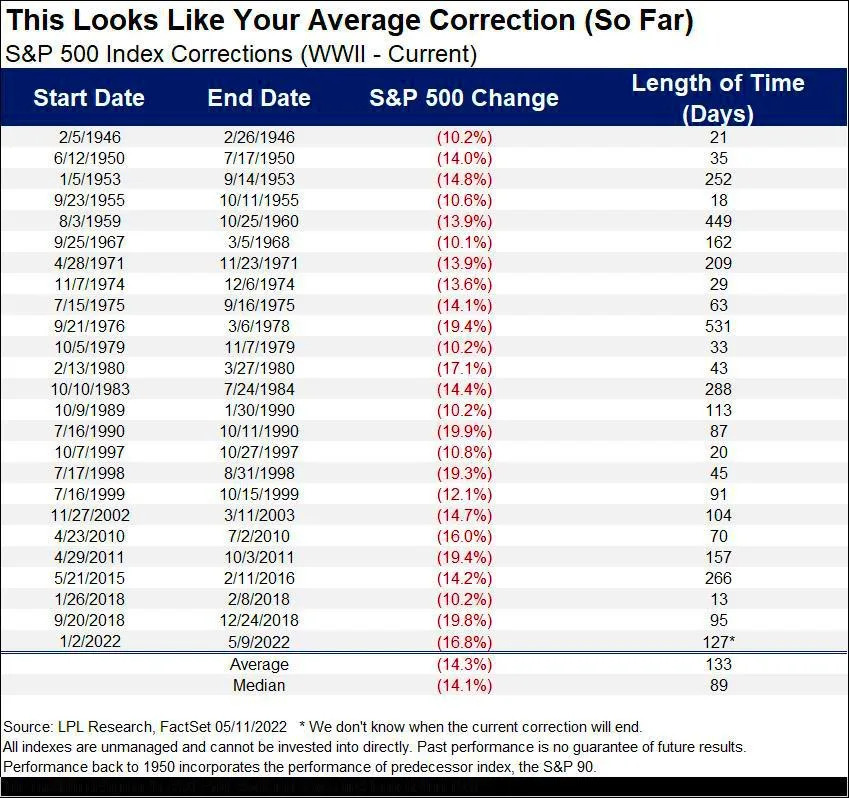
On the matter of duration, history’s stock market corrections (i.e., when the stock market falls by more than 10% but less than 20%) have had an average length of 133 days from market top to market bottom, according to data compiled by Detrick.
The current correction has run for 131 days as of Friday, which makes it pretty close to average assuming the market inflects upward soon.
And since we’re very close to being in a technical bear market, now is a good time to talk about history’s bear markets. Ben Carlson, director of institutional asset management at Ritholtz Wealth Management, reviewed the historical data.
Since 1950, the average bear market lasted 338 days (with a range of 33 to 929 days) and saw the S&P 500 fall an average 30.2% (with a maximum decline of 56.8%).
It’s worth noting that many — but not all — bear markets came with economic recessions. And as you might expect, the bear markets amid recessions tended to be worse.
Carlson observed that since 1929, recessionary bear markets lasted an average 390 days peak to trough, with stocks falling an average 39.4% during that period. Meanwhile, non-recessionary bear markets lasted an average 202 days with stocks falling an average 26.1%.
This is what investors signed up for
When talking to novices about investing in the stock market, I try to make it a point to say that you can get smoked in the short-term. In fact, TKer Stock Market Truth No. 2 is literally: “You can get smoked in the short-term.”2
Huge stock market sell-offs are normal. The S&P has historically seen an average annual max drawdown (i.e. the biggest intra-year sell-off) of 14%. Some years see milder sell-offs. Other years see worse ones.
This all speaks to two conflicting realities investors must cope with: In the long run, things almost always work out for the better, but in the short run, anything and everything can go wrong. This is what investing in the stock market is all about.
A note about the current moment…
The economic data continues to be very strong, and there continue to be massive tailwinds that suggest growth will persist.
Similarly, expectations for earnings growth have been improving. Taken with falling prices, valuations are increasingly attractive.
As of Friday, the forward P/E ratio on the S&P 500 was 16.6, according to FactSet. This is below its 10-year average of 16.9.
This combination of resilient economic growth, improving earnings expectations, and attractive valuations has at least some Wall Street pros advising clients to take on risk.
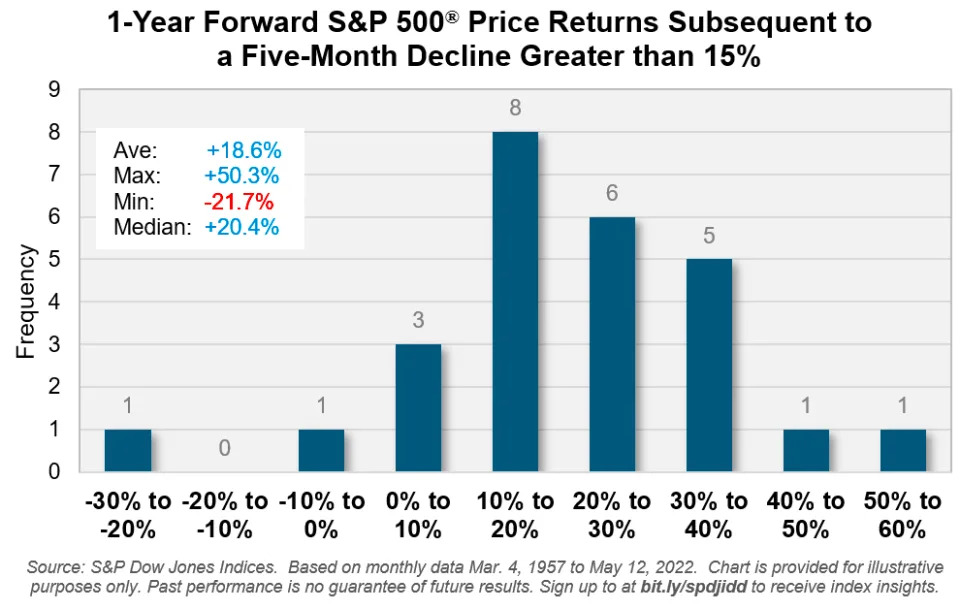
And history says that sell-offs like the one we’re experiencing now, are often followed by sharp recoveries.
According data from Benedek Vörös, director of index investment strategy at S&P Dow Jones Indices, “a decline of 15% or more [over a five-month period] for the S&P 500 has been followed by positive returns in the ensuing 12 months in all but two occasions over the past 65 years, with an average gain just shy of 20%.“
Of course, there’s no guarantee that metrics continue to move favorably, especially as the Federal Reserve actively moves to cool demand in the economy. And it’s certainly possible that stocks continue to fall, regardless of what the data justifies.
But on balance, overall conditions continue to appear favorable for investors who are able to put in the time.


