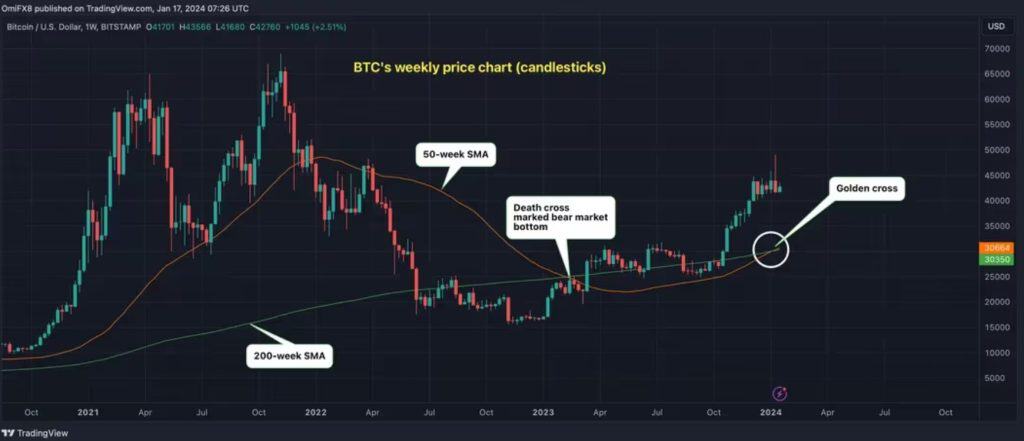
Market enthusiasts call it a “golden cross,” indicating a positive shift in asset prices, and now this marker has finally appeared on the bitcoin (BTC) weekly price chart.
The 50-week simple moving average (SMA) on bitcoin has crossed over the 200-week SMA for the first time on record, confirming the golden cross. The phrase and its counterpart, “the death cross,” in which the short-duration SMA dips below the long-duration SMA, originated in Japan, per some technical analysis textbooks.
Many traders see crossovers as forward-looking indicators, with the golden version signaling a long-term bull market ahead.
The bullish interpretation could be challenged because averages are based on past data and tends to lag prices. In other words, averages represent what happened in the past, and the first golden cross on the weekly chart results from bitcoin rallying over 70% to $42,700 in four months.
Thus, seasoned traders consider crossovers as lagging indicators, often coinciding with trend exhaustion. For instance, the weekly death cross confirmed in early 2023 marked the bottom of the bear market. Bitcoin’s daily chart golden and death crossovers have a mixed record of predicting bullish and bearish trends.
Bitcoin’s rally has already stalled, with the cryptocurrency trading 10% lower from highs near $49,000 registered after 11 spot exchange-traded funds (ETFs) began trading in the U.S. last Thursday.
Per observers, the bullish momentum has waned due to early ETF flows failing to match the sky-high market expectations.
“The Net flow of funds for the ETFs has been $965M (including seed funds), a strong start thus far. However, the spot price is down from the launch-driven euphoria as investors set unreasonably high launch expectations,” Greg Cipolaro, global head of research at NYDIG, said in a newsletter Tuesday.