Is It Too Late To Reassess Williams Companies (WMB) After Its 37% One-Year Rally?
News Team
Williams Companies scores just 2/6 on our valuation checks. See what other red flags we found in the full valuation breakdown.
Approach 1: Williams Companies Discounted Cash Flow (DCF) Analysis
A Discounted Cash Flow, or DCF, model looks at the cash Williams Companies is expected to generate in the future and discounts those cash flows back to today to get an estimate of what the stock might be worth now.
For Williams Companies, the model uses a 2 Stage Free Cash Flow to Equity approach. The latest twelve month free cash flow is about $2.06b. Analyst estimates and Simply Wall St extrapolations suggest projected free cash flow of $5.05b by 2030, with a path that includes both forecast figures and extended projections out to 2035.
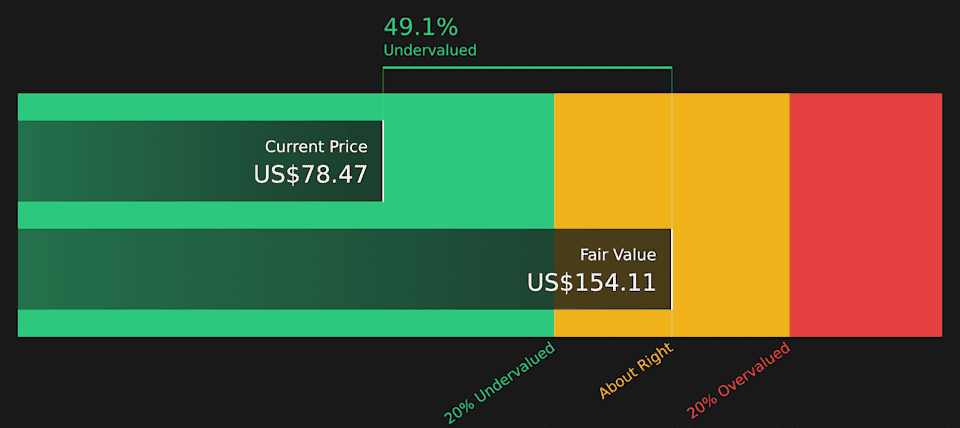
Rolling all of those cash flows together and discounting them back, Simply Wall St arrives at an estimated intrinsic value of about $154.11 per share. Against the current share price of $78.47, that implies the stock is around 49.1% below this model’s estimate of fair value. This indicates that, on this particular cash flow view, the shares are trading at a sizeable discount.
Result: UNDERVALUED
Our Discounted Cash Flow (DCF) analysis suggests Williams Companies is undervalued by 49.1%. Track this in your watchlist or portfolio, or discover 48 more high quality undervalued stocks.
Approach 2: Williams Companies Price vs Earnings
For a profitable company, the P/E ratio is a straightforward way to think about what you are paying for each dollar of earnings, which is why it is often the preferred yardstick. Higher growth expectations and lower perceived risk usually justify a higher P/E, while slower growth or higher risk tend to point to a lower, more conservative P/E as being “normal” for a stock.
Williams Companies currently trades on a P/E of 34.41x. That sits above the Oil and Gas industry average P/E of 14.61x and also above the peer group average of 16.62x. Simply Wall St’s Fair Ratio for Williams Companies is 30.55x. This Fair Ratio is a proprietary estimate of what the P/E might be given factors like earnings growth, industry, profit margins, market cap and company specific risks.
Compared with simple peer or industry comparisons, the Fair Ratio aims to be more tailored because it attempts to adjust for those company specific characteristics rather than assuming all stocks in the same industry deserve the same multiple. Setting the current P/E of 34.41x against the Fair Ratio of 30.55x suggests Williams Companies is trading above this tailored range.
Result: OVERVALUED
Upgrade Your Decision Making: Choose your Williams Companies Narrative
Earlier it was mentioned that there is an even better way to understand valuation. Narratives on Simply Wall St give you a clear story behind the numbers by linking your view of Williams Companies to specific assumptions for future revenue, earnings, margins and a fair value. These are then compared to today’s price to help you decide whether the stock looks expensive or cheap on your terms. Each Narrative lives on the Community page, updates automatically when fresh news or earnings arrive, and allows different investors to sit anywhere between a cautious fair value near US$67 and a more optimistic view closer to US$90, based on how they see projects, risks and cash flows playing out.
For Williams Companies however we will make it really easy for you with previews of two leading Williams Companies Narratives:
🐂 Williams Companies Bull Case
Fair value: US$80.07 per share
Gap to fair value based on this view: around 2.0% below that estimate
Revenue growth assumption: 11.26% a year
Focuses on expanding pipeline capacity, LNG terminal links and higher utilization on the Transco and Gulf Coast systems to support future volume and cash flow.
Leans on contracted project backlogs, decarbonization investments and margin assumptions that support the current analyst consensus fair value range.
Flags execution, permitting, cost inflation and natural gas transition risks, but still frames the current price as close to the analyst fair value of about US$80.07.
🐻 Williams Companies Bear Case
Fair value: US$67.04 per share
Gap to fair value based on this view: around 17.1% above that estimate
Revenue growth assumption: 1.78% a year
Emphasizes policy shifts toward decarbonization, renewables and storage that could leave parts of the natural gas network underused over time.
Highlights higher capital spending, permitting risk and U.S. concentration as factors that could limit future returns if gas demand softens.
Uses a lower fair value of about US$67.04, so on this view the recent share price looks richer relative to expected revenue and earnings.
If you want to see how other investors are blending these kinds of assumptions, the full range of Williams Companies Narratives on Simply Wall St lets you line up your own expectations on growth, risk and valuation with different fair value outcomes.