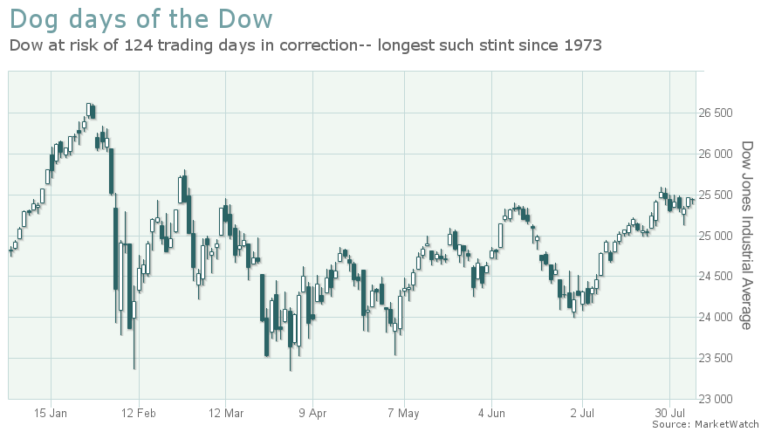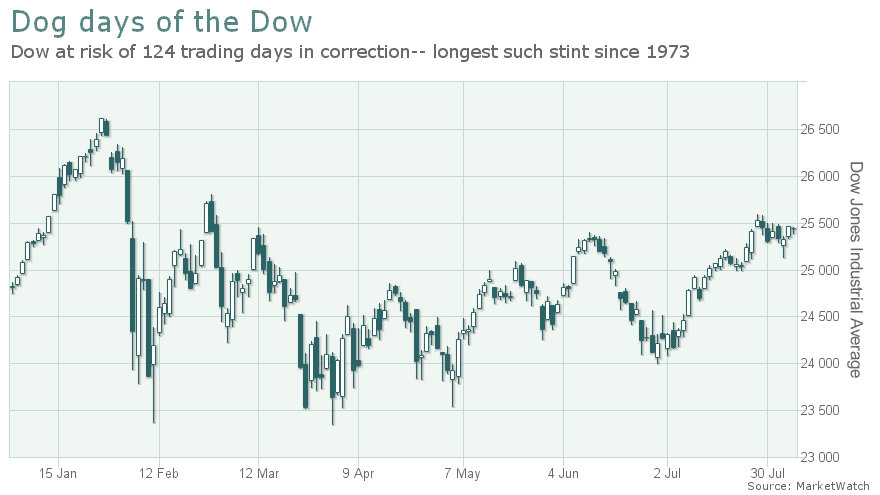

Talk about the dog days! The Dow Jones Industrial Average registered a dubious distinction at the closing bell Monday, despite its attempt at a rally.
The blue-chip benchmark failed to move 10% above the closing low hit earlier in the year, and with that has now spent the longest period in correction territory, 124 trading sessions, since the 130-session stint the benchmark spent in correction back in 1973, according to Dow Jones Market Data.
That’s the same year that “The Godfather,” directed by Francis Ford Coppola, won best picture at the 45th Academy Awards and Marlon Brando rejected the Oscar for best actor for his portrayal of crime boss and patriarch, Vito Corleone, in the same film.
By one reckoning, the Dow industrials DJIA, +0.16% stands now about 1.6% short of emerging from correction territory after putting its 2018 low of 23,533.20 on March 23. It needs to close at a level 25,886.42 to achieve that. Some market technicians believe that an asset must put in a new high to officially emerge from correction. Others make the case that a 10% gain from the low point of its decline is sufficient, a characterization that MarketWatch adheres to.
The Dow and the S&P 500 index SPX, +0.35% fell into correction territory, usually defined as a drop of at least 10% from a recent peak, on Feb. 8.
But since early stumbles at the start of the year, which came to a head in February, only the Dow remains in a correction phase among its benchmark peers. The S&P 500 exited its lengthiest in run in correction in about 34 years late last month.
MarketWatch’s Ryan Vlastelica has noted that such lengthy stock-market corrections are extremely unusual. According to Dow Jones data, the longest stretch in correction territory in Dow history was 223 trading days in 1961, while the average correction for the Dow has lasted a little over 50 trading sessions since the inception of the 122-year-old equity gauge. The last five corrections on average have lasted fewer than 40 trading days. (It’s worth noting that the averages don’t also include drops that pushed the Dow into bear-market territory, defined as a drop of at least 20% from a recent peak.)
The Nasdaq Composite Index COMP, +0.61% has thus far led the way higher, recording some 25 all-time highs in 2018. Meanwhile, the Dow is about 4% shy of a fresh peak, while the S&P 500 index is less than 0.7% from a record.
Stocks have mostly moved in fits and starts, with the Dow, particularly, facing stiff headwinds as worries about trade wars between the U.S. and China and other major developed economies have continued to dog the benchmark, which comprises some of the biggest companies in the world, many of which are notably vulnerable to trade tensions.
All that said, the fallow period for the Dow may be viewed from a bullish eye, with the stagnant, narrow trading that the gauge has seen, perhaps, suggesting that bigger, steadier moves might emerge from this period in the doldrums.