Bitcoin’s price pushed higher following better-than-expected inflation data on Tuesday. The report showed U.S. inflation rising 7.1% versus the 7.3% projected by economists responding to a FactSet survey. Core inflation, which excludes more volatile food and fuel costs, increased 6% versus expectations of 6.2%.
November marks the second consecutive month that inflation has risen at a slower pace than expected. The positive report strengthens the perception that the Fed’s Federal Open Market Committee (FOMC) interest rate increases are having the desired impact of taming inflation.
The probability the FOMC will increase rates by a 50 basis points (bps) during its next meeting this week increased to 82%, from 73.5% a day prior. The FOMC raised rates by 75 bps at its last four meetings. Market participants are hoping that the central bank will soon end its monetary hawkishness altogether.
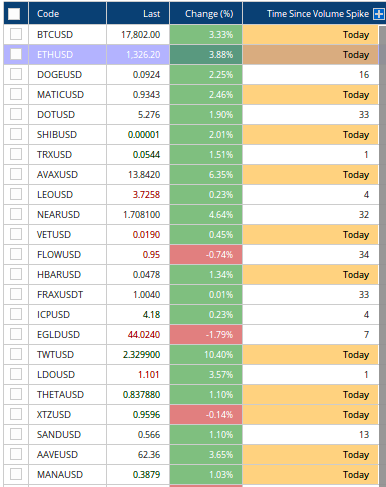
Bitcoin (BTC) and ether (ETH) prices jumped immediately after Tuesday’s CPI announcement and were recently up 3.9% and 4.7%, respectively.
A screen for high trading activity shows BTC and ETH appearing on a list of more than 10 cryptocurrencies whose trading volume exceeded its 20-day moving average by more than 50%.

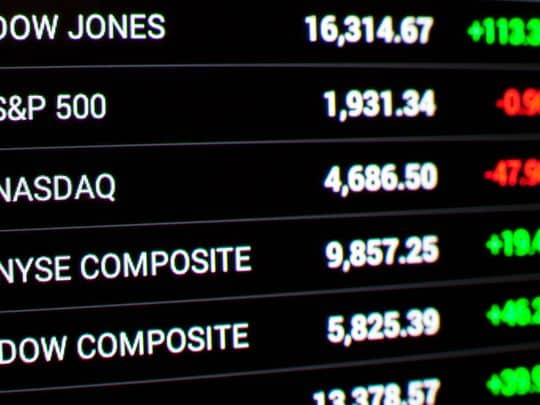
Traditional assets rallied initially before paring gains midday. The Dow Jones Industrial Average (DJIA) recently declined 0.12%, while the S&P 500, and Nasdaq Composite increased a paltry 0.4% and 0.25%, respectively.
Bond yields declined across the maturity curve, with shorter-term Treasurys decreasing more sharply than longer-term Treasurys. Many investors will likely deem this significant because it shows that currently inverted yield curves are becoming less inverted.
An inverted yield curve occurs when shorter-term debt has a higher yield than longer-term debt. Inverted yield curves have historically preceded economic recessions and imply declining confidence in short-term economic prospects.
In combating inflation, the securities holdings on the Federal Reserve’s balance sheet declined to $8.6 trillion for the week, ending Dec 7, down $76.7 billion from this time last year.
Trading activity over the next several days will show whether today’s push higher results in short-term profit taking or represents a sustained increase in prices.
BTC has ground to cover before it reaches psychologically important $20,000 support when viewing the asset’s moving averages. On a positive note, its current price is approaching its 50-day moving average of $17,895.
The 50-day moving average is now within 15% of the 200-day moving average of $20,852. The $20,000 mark for BTC also represents the on-chain realized price for market participants. Recapturing this level would push BTC past a significant technical resistance and key price point.
Ether’s price is a bit further on. Its daily price has risen to match its 50-day moving average, and it sits less than 10% away from its 200-day average.


