


")


Bitcoin (BTC) price could become proof of the general wisdom rule in financial markets that is known as the proverb “Sell in May and walk away.” Looking at the candle stick formation from the past two weeks and adding this week’s performance, it could spell trouble ahead. With lower highs and lower lows, the peak of April is fading and might see Bitcoin selling off in May towards $22,000.
Bitcoin price to embody the financial proverb “sell in May and walk away”
Bitcoin price must have had bulls all excited earlier this week as BTC popped back above $30,000. Unfortunately, that good news quickly got forgotten as later in the week, BTC faded and started to say goodbye to the level by nearing the lower end of $29,000. As such still nothing to worry about, except that the weekly chart reveals a clear bearish trend with lower lows and lower highs, confirming that bears are at work here.
BTC has one element that could be crucial going forward: the 55-day Simple Moving Average (SMA) that caught the decline during the week near$27,060. Once Bitcoin price starts to make lower lows next week, it will be clear that the 55-day SMA support was short-lived, and the decline is set to continue. Traders must brace themselves for a selloff that could go as far as $22,000 to find support near the 200-day SMA and drag Bitcoin price 25% for the month of May.
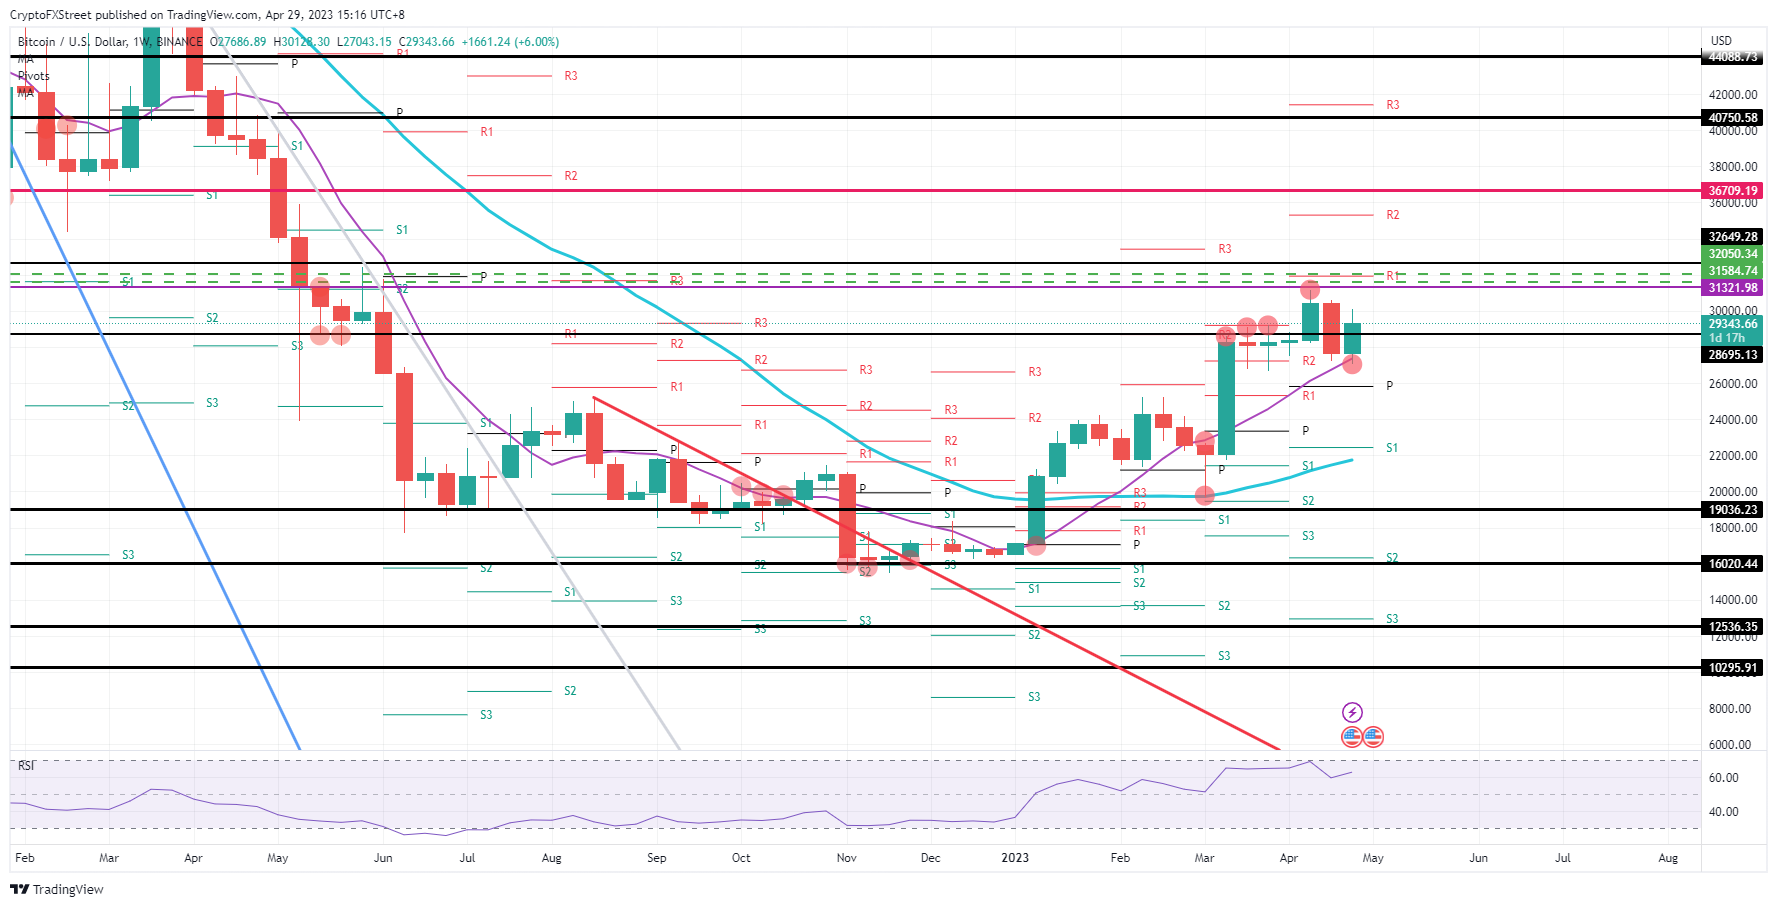
BTC/USD weekly chart
The simple three-week pattern could still get broken or erased when bulls can break back above $30,000. Ideally, the high of last week, near $30,580, needs to get broken to the upside in order to break this pattern and avoid a double-top formation. From there, it is only a sigh to head to $31,321 and enter a distribution zone that might alleviate Bitcoin price towards $33,000 by the summer.


