


Bitcoin price corrected gains and retested the $30,650 support. BTC could start a fresh increase if it stays above the $30,000 support zone.
- Bitcoin is holding gains above the $30,650 support zone.
- The price is trading above $30,700 and the 100 hourly Simple moving average.
- There is a key bullish trend line forming with support near $30,700 on the hourly chart of the BTC/USD pair (data feed from Kraken).
- The pair could start a fresh increase if it stays above the $30,650 support zone.
Bitcoin Price Remains Stable
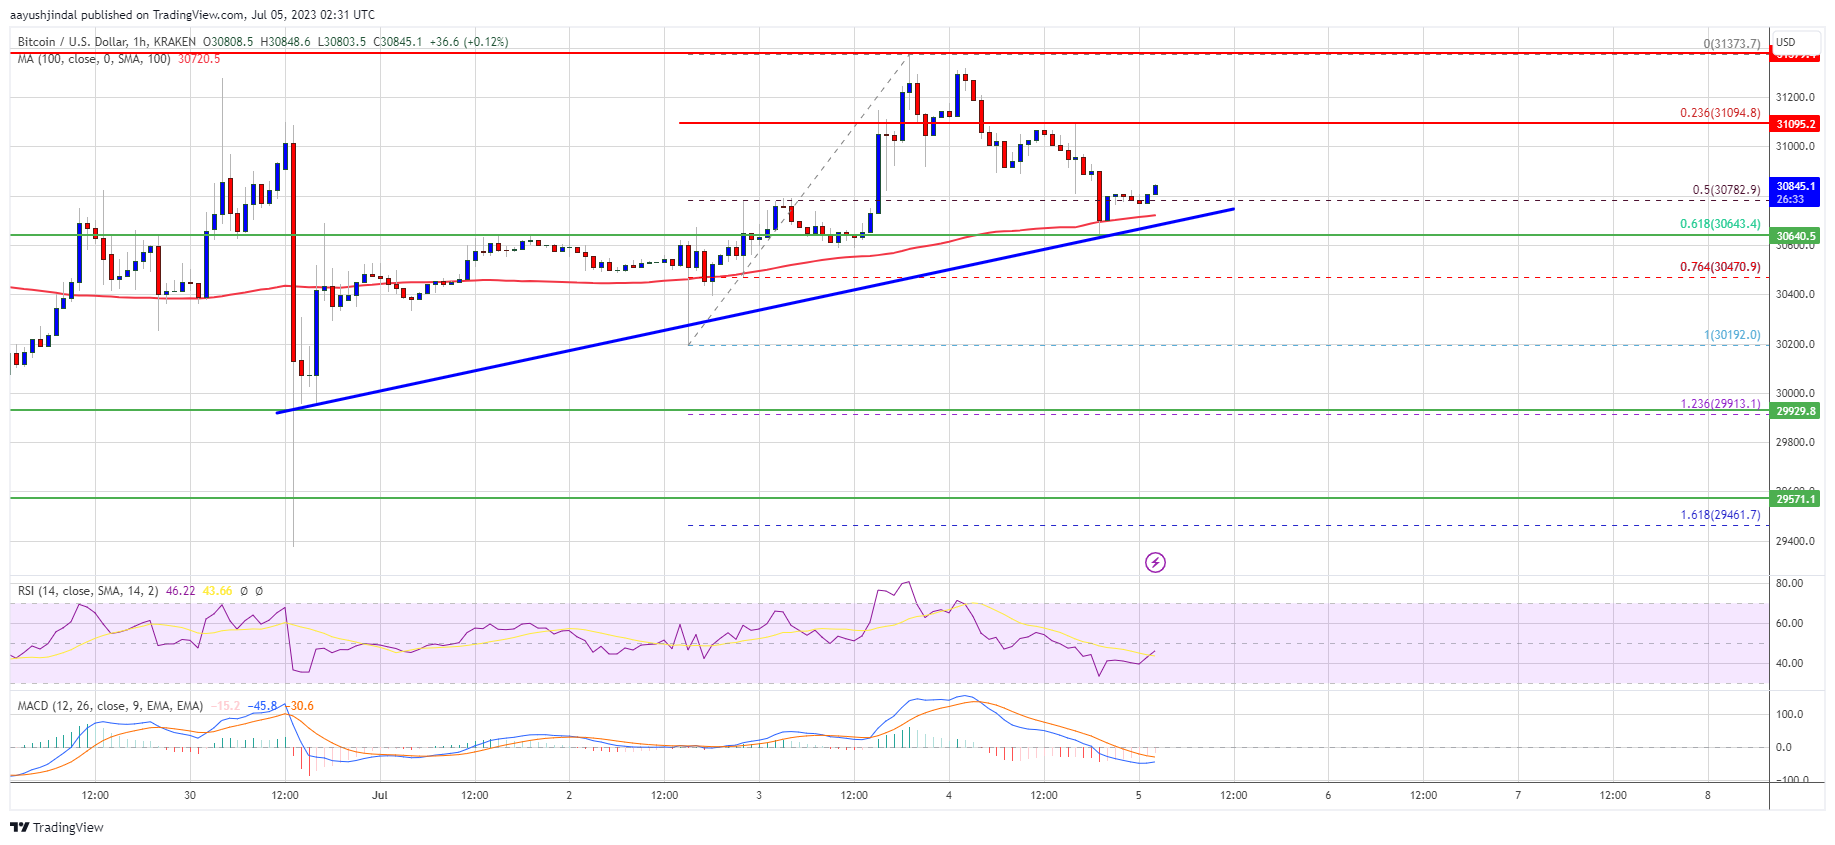
Bitcoin price struggled to clear the key $31,400 resistance zone. BTC started a downside correction below the $31,000 and $30,800 levels.
The price declined below the 50% Fib retracement level of the upward move from the $30,192 swing low to the $31,372 high. However, the bulls were seen active near the $30,650 support zone and the 100 hourly Simple moving average.
Bitcoin also tested the 61.8% Fib retracement level of the upward move from the $30,192 swing low to the $31,372 high. It is now trading above $30,700 and the 100 hourly Simple moving average.
There is also a key bullish trend line forming with support near $30,700 on the hourly chart of the BTC/USD pair. Immediate resistance is near the $31,050 level. The first major resistance is near the $31,250 level, above which the price might start rise toward $31,400.
A close above the $31,400 resistance could start another strong increase. The next major resistance is near the $32,000 level. Any more gains could open the doors for a move toward the $32,500 resistance zone.
More Losses in BTC?
If Bitcoin’s price fails to clear the $31,050 resistance, it could continue to move down. Immediate support on the downside is near the $30,650 level and the trend line and the 100 hourly Simple moving average.
The next major support is near the $30,470 level, below which there could be a drop toward $30,200. Any more losses might send the price toward the $30,000 zone, under which there is a risk of a larger decline.
Technical indicators:
Hourly MACD – The MACD is now losing pace in the bullish zone.
Hourly RSI (Relative Strength Index) – The RSI for BTC/USD is below the 50 level.
Major Support Levels – $30,650, followed by $30,200.
Major Resistance Levels – $31,050, $31,400, and $32,000.


