Stock Markets
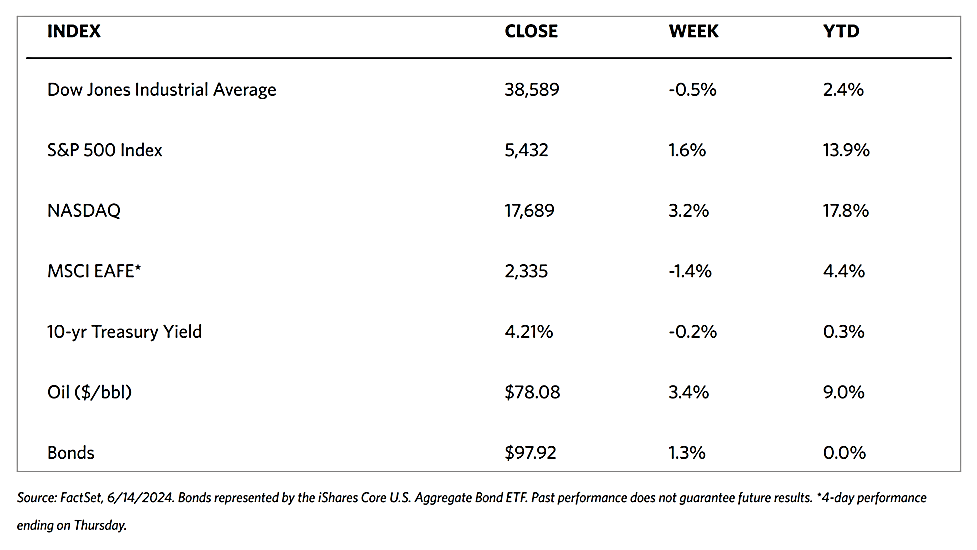
The major stock indexes ended mixed for the week. The 30-stock Dow Jones Industrial Average (DJIA) dipped by 0.54% while the Total Stock Market was up by 1.33%. The broad S&P 500 Index also closed up, this time by 1.58%, with its Mid Cap 400 and Small Cap 600 down but its Super Composite 1500 up. The technology-heavy Nasdaq Stock Market Composite significantly outperformed other indexes by closing 3.24% up, suggesting technology stocks surged while other sectors slumped. The NYSE Composite Index closed 0.94% down. There was a rise in risk perception among investors as the CBOE Volatility Index (VIX) rose by 3.60%.
The key indexes, S&P 500 Index and Nasdaq Composite, touched new highs for the week, but as noted from the preceding results, the market advance was extremely narrow for the second consecutive week. As if to underscore this fact, the equally-weighted version of the S&P 500 trails its more popular, capitalization-weighted counterpart by 215 basis points (2.15 percentage points). The outperformance of technology stocks and growth shares appears traceable to investor enthusiasm over the potential of artificial intelligence. The Russell indexes suggest that these stock segments are outpacing value stocks by the largest margin (461 basis points) since March 2023. The week was also marked by the shareholder approval of Tesla CEO Elon Musk’s approximately USD 48 billion pay package (in Tesla stock).
U.S. Economy
Another reason for growth shares to outperform may be the heartening inflation releases and falling interest rates. Both factors increase the theoretical value of the future earnings of growth companies. The Labor Department on Wednesday announced that headline consumer price index (CPI) inflation remained unchanged in May for the first time in almost two years. Core inflation (excluding volatile food and energy prices) rose by 0.2% which is slightly below expectations and a seven-month low. Year-over-year core inflation dipped to 3.4%, the lowest level since April 2021.
On Thursday, the producer price index (PPI) inflation was reported and, as with the CPI, was lower than expected. Though anticipated to have a slight increase, the PPI fell by 0.2%, thus defying expectations. Core PPI fell back to 2.3% year-over-year, thereby ending five consecutive months of increases. Import prices fell by 0.4% in May, their first decline in four months. The benign consumer inflation data seemed to have little impact on Federal Reserve policymakers. The scheduled policy meeting of the Fed was concluded on Wednesday, following which it released its quarterly summary of individual members’ economic projections. Median growth expectations remained unchanged, but expectations for core personal consumption expenditure (PCE) – the Fed’s preferred inflation metric – in 2024 rose from 2.4% to 2.8%.
Surprise jumps in weekly and continuing jobless claims also calmed inflation fears, but may have raised concerns about the overall economic health. About 242,000 Americans filed for unemployment over the week ended June 8, the most in almost a year. Over the week preceding, 1.82 million people filed at least two weeks of claims, the most since the week ended January 20 and the third-highest number over the past year.
Metals and Mining
This week, data from the People’s Bank of China showed that it did not increase its reserves last month. This appears to mark an end to its 18-month shopping spree, spooking gold traders who have been relying on Chinese central bank buying. The yellow metal closed the week 1% above its critical support of $2,300. It does not seem likely that China is done buying gold, given all the geopolitical uncertainty around the world. In a world where the US. dollar faces growing competition as the world’s reserve currency, analysts say that gold will play a growing role in a multipolar currency world. This is because gold remains one of the most liquid monetary assets in global financial markets today. This week, the U.S. dollar appears to have assumed a diminished role in the world stage with the expiration of the petrodollar. For the past 50 years, the U.S. and Saudi Arabia abided by the trade agreement that all oil trade would be denominated in U.S. dollars, cementing the dollar’s status as the world’s reserve currency and ushering in an era of American prosperity. In exchange, the U.S. provided military support and protection to the KSA.
The spot prices of precious metals ended mixed for the week. Gold, which ended last week at $2,293.78, closed this week at $2,333.04 per troy ounce for a rise of 1.71%. Silver climbed by 1.37% from its closing price last week of $29.15 to settle at $29.55 per troy ounce, Platinum ended this week at $961.30 per troy ounce, a decline of 0.67% from the last weekly trading price of $967.81. Palladium, which closed last week at $915.01, last traded this week at $894.16 per troy ounce for a decline of 2.28%. The three-month LME prices for industrial metals were also mixed. Copper, which closed last week at $9,762.50, ended this week at $9,741.50 per metric ton for a slide of 0.22%. Aluminum came down by 2.35% from last week’s close of $2,578.00 to settle at $2,517.50 per metric ton. Zinc ended the week at $2,767.50 per metric ton, 0.02% higher than last week’s close at $2,767.00. Tin climbed by 2.75% from its previous weekly close at $31,452.00 to close the week at $32,318.00 per metric ton.
Energy and Oil
Oil markets are back their regular swings after several weeks of unpredictable see-sawing. The uncertainty introduced by distortionary factors was significant to the extent that the International Energy Agency (IEA) and OPEC have contrasting views and publicly argue about the future of oil demand. The IEA predicts a 2029 peak in global oil demand at 105.6 million barrels per day (b/d) and foresees a price slump in line with its forecast that global supply capacity will reach nearly 114 million b/d by the end of this decade. The OPEC calls this IEA report a “dangerous commentary,” stating that it does not see a peak in oil demand until 2045 at the soonest and that consumption will grow to a hefty 116 million b/d. To date, the Federal Reserve has still not announced with any certainty its forthcoming interest rate cuts, and there remain questions about the strength of summer gasoline demand.
Natural Gas
For the report week starting Wednesday, June 5, and ending Wednesday, June 12, the Henry Hub spot price climbed by $0.58, from $2.22 per million British thermal units (MMBtu) to $2.80/MMBtu. Regarding Henry Hub futures, the price of the July 2024 NYMEX contract increased by $0.288, from $2.757/MMBtu at the start of the report week to $3.045/MMBtu by the week’s end. Before Tuesday, when the front-month futures price settled at $3.129/MMBtu, the front-month price had not been above $3.00/MMBtu since January. The price of the 12-month strip averaging July 2024 through June 2025 futures contracts climbed $0.236 to $3.459/MMBtu
International natural gas futures price changes were mixed this report week. The weekly average front-month futures prices for liquefied natural gas (LNG) cargoes in East Asia increased by 1 cent to a weekly average of $11.99/MMBtu. Natural bas futures for delivery at the Title Transfer Facility (TTF) in the Netherlands, the most liquid natural gas market in Europe, decreased by $0.19 to a weekly average of $10.81/MMBtu. In the week last year corresponding to this report week (beginning June 7 and ending June 14, 2023), the prices were $9.29/MMBtu in East Asia and $10.40/MMBtu at the TTF.
World Markets
The pan-European STOXX Europe 600 Index declined by 2.39% due to the political uncertainty that undermined confidence following the strong showing by far-right parties in the European Parliament elections held during the previous weekend. All of the major indexes succumbed to the fallout. Germany’s DAX fell by 2.99%, Italy’s MIB shed 5.76%, and France’s CAC 40 Index plunged by 6.23%. The UK’s FTSE 100 Index gave up 1.19%. The European Union elections showed a broad shift toward right-wing and far-right parties. Weighed down by political risk, the European markets began the week with uncertainty after French President Macron announced the holding of snap legislative elections later in June. There was little done to sway the mood, including comments from European Central Bank President Christine Lagarde confirming that restrictive monetary policy in Europe has not ended and that no further rate cuts are coming anytime soon. European equities generally ended the week further negatively inclined due to macro-updates that were released later in the week. Among the positive news, Euro trade data showed a surplus balance in April due to exports growth far exceeding imports. This was swamped, however, by negative news that industrial production fell unexpectedly in April, easing 0.1%, against a forecast 2% growth. The UK economy stagnated in April as falls in both production and construction output offset growth in services output.
Japan’s equities ended mixed for the week. The Nikkei 225 Index gained 0.3% while the broader TOPIX Index slumped 0.3%. The results of the June meeting held by the Bank of Japan (BoJ) were perceived as broadly dovish, which in turn lent support to the stock markets. In the fixed-income markets, the yield on the 10-year Japanese government bond (JGB) dipped from 0.98% (the previous week’s end) to 0.93%. The yen, which is already historically at its lows, further weakened over the week from JPY 156.6 to around JPY 157.5 against the USD. The BoJ announced that its monetary policy will remain unchanged and voted to scale back its JGB purchases, defying market expectations that the central bank would reduce its bond-buying this month. Japan’s GDP contracted by 1.8% on an annualized basis over the first quarter of the year, according to revised data. This is less than the initial estimates of 2.0% due largely to an upward revision in private inventories. The main contributors to the weakness of the GDP in the first quarter were the economic impact of the earthquake that hit Japan’s Noto peninsula in January and the suspension of some auto production. On the inflation front, producer prices increased by 2.4% year-on-year in May. This reading exceeds market expectations of a 2.0% rise.
Chinese equities declined during this holiday-shortened week. (Markets in China were closed on Monday in celebration of the Dragon Boat Festival.) The Shanghai Composite Index slid by 0.61% and the blue-chip CSI 300 fell by 0.91%. Hong Kong’s benchmark Hang Seng Index plunged by 2.31%. In China’s inflation readings, the country’s consumer price index (CPI) rose by 0.3% in May from a year earlier and is still lower than expectations, unchanged from its rise in April. Core inflation (which excludes volatile food and energy costs) climbed by 0.6% which is slower than the 0.7% increase in April. The producer price index (PPI) fell by 1.4% year-on-year, declining for 20 consecutive months, but eased from a 2.5% drop in April. Factors that kept a lid on prices in China were weak consumer confidence and a protracted property sector slump which prevailed despite numerous measures adopted by Beijing to prop up the markets and the economy over the past year. Highlighting consumer caution in China was data from the Dragon Boat Festival. The Ministry of Culture and Tourism reported that over the three-day holiday, tourism revenue rose by 8.1% over the 2023 results but still lagged pre-pandemic levels. While it was encouraging to note that domestic traffic rose by 6.3% from last year, average spending per traveler, however, fell by 12.3% from 2019. Analysts expect Beijing to continue rolling out support to spur demand in light of the weak consumer sentiment dragging down the economy.
The Week Ahead
Retail sales data, housing starts, industrial production, and capacity utilization are among the important economic reports scheduled for release in the coming week.
Key Topics to Watch
- Empire State manufacturing survey for June
- Philadelphia Fed President Patrick Harker speech (June 17)
- Fed Governor Lisa Cook speech (June 17)
- U.S. retail sales for May
- Retail sales minus autos for May
- Industrial production for May
- Capacity utilization for May
- Business inventories for May
- Richmond Fed President Tom Barkin podcast interview (June 18)
- Fed Governor Adriana Kugler speech (June 18)
- Dallas Fed President Laurie Logan speech (June 18)
- Louis Fed President Alberto Musalem speech (June 18)
- Chicago Fed President Austan Goolsbee speech (June 18)
- Home builder confidence index for June
- Initial jobless claims for June 15
- U.S. current account for Q2
- Housing starts for May
- Building permits for May
- Philadelphia Fed manufacturing survey for June
- S&P flash U.S. services PMI for June
- S&P flash U.S. manufacturing PMI for June
- Existing home sales for May
- U.S. leading economic indicators for May
Markets Index Wrap-Up