Stock Markets
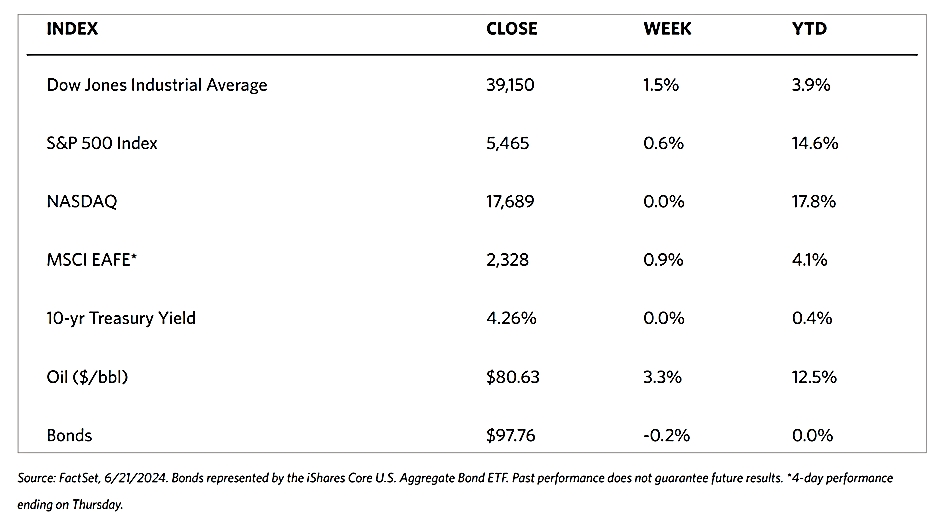
The major stock indexes are mostly up over the shortened trading week (markets were closed on Wednesday for the Juneteenth holiday) although the gains are modest. The Dow Jones Industrial Average, a 30-stock index, closed 1.45% higher than last week, while the Dow Jones Total Stock Market Index closed higher by 0.63%. The broad S&P 500 ended 0.61% higher, not surprisingly mirroring the Total Stock Market Index. The technology-heavy Nasdaq Stock Market Composite underperformed the other major indexes by moving sideways this week, neither climbing nor dipping. The NYSE Composite gained 1.00% for the week. The CBOE Volatility Index (VIX), the indicator of investors’ risk perception, moved higher by 4.27%.
There were modest signs of market broadening and rotation as value stocks outperformed growth stocks and, as seen above, most of the major benchmarks did better than the technology-tracking Nasdaq Composite. On Friday, roughly $5.5 trillion in options related to indexes, individual stocks, and exchange-traded funds were set to expire, earning for that day the term “triple-witching day.” In the bond markets, the lackluster retail sales data released during the week appeared to push longer-term Treasury yields lower. Friday’s stronger S&P Global readings, however, provided some support to bring them up and end the week modestly higher. Tax-exempt municipal bond yields remained relatively steady for most of the week.
U.S. Economy
Economic news releases at the start of the week suggested that easing labor demand and dwindling savings are pushing consumers to adopt greater caution. The Commerce Department reported on Tuesday that retail sales increased only by 0.1% in May based on advanced estimates, while falling by a downwardly revised 0.2% in April. Sales at bars and restaurants notably fell by 0.4%. This metric in particular is signaling less discretionary spending, but sales of grocery stores also fell 0.4%. Since retail sales data are not adjusted for inflation, the latter figures on grocery store sales perhaps reflect recent price cuts in certain food categories.
Manufacturing data released this week were somewhat stronger. In a reversal of recent trends, the Federal Reserve announced that industrial production expanded by 0.9% in May. This is well above consensus expectations and the fastest pace in almost a year. Factories were also operating a tick above expectations and at the highest level since last November, at 78.7% of capacity. Data released later in the week suggest that the economy was stronger than the retail sales data indicated. S&P Global announced on Friday that its composite index of business activity had climbed to 54.6 in June based on preliminary data, its best level in two years. Figures above 50.0 indicate expansion. With payrolls increasing at the best pace in five months and rebounding from two months of declines, the services sector appeared to be in rather good shape. Other good news shows selling price pressures in the services sector were among the lowest recorded since the start of the pandemic. However, there appears to be some pressure on operating margins in this sector as service providers continue to face higher wage bills.
Metals and Mining
Gold continues to churn within a narrow range between $2,300 to $2,350 per ounce, causing some frustration among investors. This may be perceived as a helpful consolidation that shakes out short-term players and allows investors to focus on the broader landscape. Its sojourn above the $2,300 support comes after an impressive run that began in March and rallied to a record high above $2,450 per ounce. While momentum has currently stalled, the factors behind the rally remain intact, suggesting that the rally may resume after gains have been consolidated. The present geopolitical uncertainty is an opportune time for the market to digest the gains so far, particularly with the November elections on the horizon.
The spot prices of precious metals closed mixed for this week. Gold closed at $2,321.98 per troy ounce, lower by 0.47% from last week’s closing price of $2,333.04. Silver was unchanged, closing the week at $29.55 per troy ounce, same as last week. Platinum gained 3.50% over its closing price last week at $961.30 to end at $994.90 per troy ounce. Palladium ended this week at $954.81 per troy ounce, 6.78% higher than last week’s close of $894.16. The three-month LME prices of base metals also ended mixed. Copper closed at $9,682.50 per metric ton, lower by 0.61% from last week’s close at $9,741.50. Aluminum, which closed last week at $2,517.50, descended by 0.16% to end this week at $2,513.50 per metric ton. Zinc, on the other hand, closed at $2,844.00 per metric ton, 2.76% higher than its last weekly close at $2,767.50. Tin gained by 1.09% from last week’s closing price of $32,318.00 to its closing price this week at $32,671.00 per metric ton.
Energy and Oil
Several factors have come together to lift oil prices to their highest levels since early May. These include improving demand figures corroborated by shrinking crude and product inventories, the onset of hurricane season in the U.S., and more visible Chinese buying. Regarding the weather system in America, a storm system has recently made landfall in northeast Mexico, becoming the first named tropical storm of the 2024 Atlantic hurricane season. Tropical Storm Alberto brings heavy rains that are disrupting lightering operations in Corpus Christi and Beaumont. Furthermore, the dysfunctional Red Sea navigation has once again caught the attention of the market, with the Houthis shrinking another bulker this week, thereby exerting upward pressure on oil prices.
Natural Gas
For the report week beginning Wednesday, June 12, and ending Wednesday, June 19, the Henry Hub spot price rose by $0.58 from $2.22 per million British thermal units (MMBtu) to $2.80/MMBtu. Regarding Henry Hub futures, the price of the July 2024 NYMEX contract increased by $0.288, from $2.757/MMBtu at the start of the report week to $3.045/MMBtu at the week’s end. Before Tuesday, when the front-month futures price settled at $3.129/MMBtu, the front-month price had not been above $3.00/MMBtu since January. The price of the 12-month strip averaging July 2024 through June 2025 futures contracts climbed by $0.236 to $3.459/MMBtu.
This report week, international natural gas futures price changes were mixed. The weekly average front-month futures prices for liquefied natural gas (LNG) cargoes in East Asia increased by $0.01 to a weekly average of $11.99/MMBtu. Natural gas futures for delivery at the Title Transfer Facility (TTF) in the Netherlands, the most liquid natural gas market in Europe, decreased by $0.19 to a weekly average of $10.81/MMBtu. In the week last year corresponding to this report week (beginning June 7 and ending June 14, 2023), the prices were $9.29/MMBtu in East Asia and $10.40/MMBtu at the TTF.
World Markets
European stocks ended marginally higher this week, with the pan-European STOXX Europe 600 Index gaining by 0.79%.in local currency terms. The market rebound is seen as the result of abating worries about political uncertainty and the improving outlook of the monetary policy. Major stock indexes gained lost ground. Italy’s FTSE MIB surged by 1.67%, France’s CAC 40 Index gained by 1.67%, and Germany’s DAX climbed by 97%. The UK’s FTSE 100 put on 1.12%. In June, private security business activity in the eurozone slowed and performed short of expectations. Manufacturing contracted sharply while services lost momentum, according to purchasing managers’ surveys. According to preliminary figures compiled by S&P Global, the HCOB Composite Purchasing Managers’ Index (PMI), which combines activity in manufacturing and services, dropped from 52.2 in May to 50.8 in June, just a hairline above the 50.0 demarcation between expansion (above 50) and contraction (below 50). Overall business activity increased slightly, while the slowdown in the rate of expansion suggested weakness in manufacturing production. Meanwhile, a decrease in new orders in France caused output to contract for a second straight month.
Japan’s stock markets lost ground for this trading week. The Nikkei 225 Index fell by 0.6% while the broader TOPIX Index lost by 0.8%. The lackluster performance in the stock markets may be traced to uncertainty about the future trajectory of the monetary policy of the Bank of Japan (BoJ) which weighed on sentiment. As investors sought to digest data showing that inflation had speeded up in May and speculation grew rife that this may affect the BoJ’s decision about when to next raise interest rates, the yield on the 10-year Japanese government bond (JGB) rose from 0.93% in the preceding week to 0.97%, this week. Following a 2.2% uptick in April, the nationwide core consumer price index rose by 2.5% year-on-year in May, although this fell slightly short of consensus expectation for a 2.6% increase. In currencies, the yen softened to around JPY 158.8 against the USD from the week-ago JPY 157.4. The yen hovers near fresh 34-year lows as it continues to be weighed down by U.S.-Japan interest rate differentials. If speculative or excessive volatility materializes in the foreign exchange markets, Japanese authorities expressed their readiness to intervene and support the yen.
Chinese equities pulled back as investor sentiment was dampened by mixed economic news. The Shanghai Composite Index dropped by 1.14% even as the blue-chip CSI 300 slumped by 1.3%. The Hang Seng benchmark Hang Seng Index climbed by 0.48%. Industrial production advanced by a weaker-than-expected 5.6% in May compared to one year ago, slowing from the 6.7% April growth rate. In the calendar year to May, fixed asset investment grew by 4% compared with a year ago, but eased from the January to April period as real estate investment declined deepened. Retail sales increased by 3.7% in May year-on-year which exceeded consensus expectations and outpaced the 2.3% gain in April. The nationwide urban employment rate remained unchanged at 5%. China’s new home prices fell by 0.7% in May, accelerating from April’s 0.6% drop. According to the statistics bureau, this marks the deepest month-on-month contraction in almost a decade. This is the eleventh consecutive month that new home prices declined, and it comes after Beijing launched a historic rescue package in May intended to revive the property sector. The housing market slump remains a significant drag on the economy and analysts caution that the measures unveiled by the government may be insufficient to halt the further descent of the housing market slump.
The Week Ahead
The PCE inflation data, consumer confidence data, and new and pending home sales are among the important economic releases in the coming week.
Key Topics to Watch
- Fed Gov. Christopher Waller speech in Rome (June 24)
- Chicago Fed President Austan Goolsbee TV appearance (June 24)
- San Francisco Fed President Mary Daly speech (June 24)
- Fed Gov. Michelle Bowman speech in London (June 25)
- S&P Case-Shiller home price index (20 cities) for April
- Consumer confidence for May
- Fed Gov. Lisa Cook speech (June 25)
- New home sales for May
- Initial jobless claims for June 22
- GDP (2nd revision) for First Quarter
- Durable-goods orders for May
- Durable-goods minus transportation for May
- Pending home sales for May
- Richmond Fed President Tom Barkin speech in Paris (June 28)
- Personal income (nominal) for May
- Personal spending (nominal) for May
- PCE index for May
- PCE (year-over-year)
- Core PCE index for May
- Core PCE (year-over-year)
- Chicago Business Barometer (PMI) for June
- Consumer sentiment (final) for June
- Fed Gov. Michelle Bowman speech (June 28)
Markets Index Wrap-Up