Bond Selloff Resumes, Dragging Asia Open After U.S. Decline
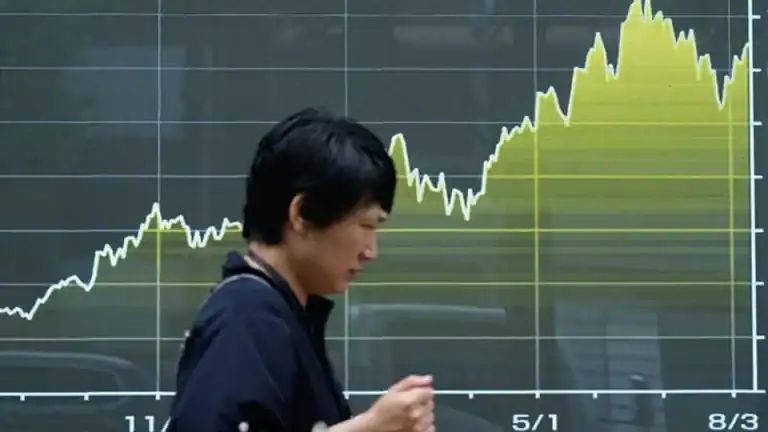
Asian shares were poised to slide after U.S. equities closed lower, with benchmark bond yields and crude both climbing and investors treating the Treasury's cap on borrowing costs as temporary.
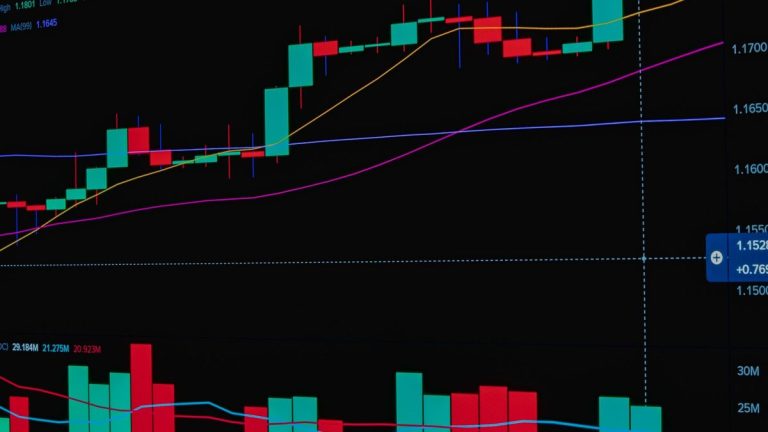
Asian equities were set to open lower on Aug. 21 after U.S. stocks fell on Aug. 20, with the S&P 500 ETF closing down 0.84% at $762.60, the Nasdaq 100 ETF down 0.72% and the Dow ETF down 1.25%, as oil prices and benchmark bond yields climbed.
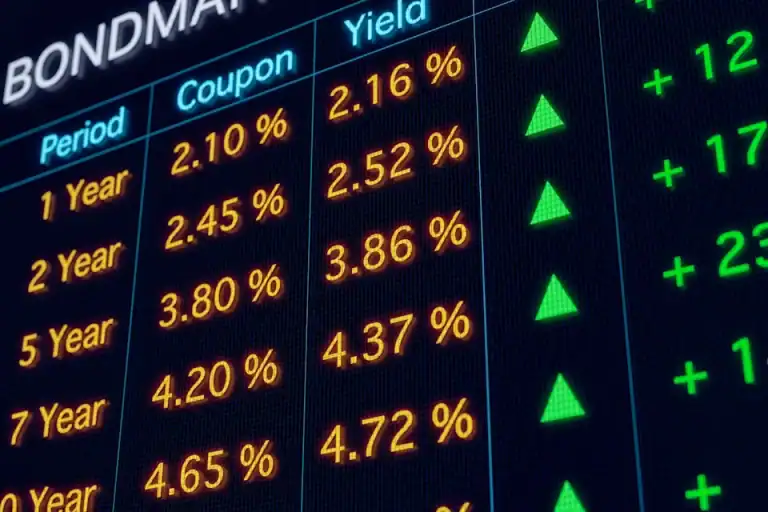
Asian equity markets were set to open lower on Friday after a weak U.S. session in which rising bond yields and firmer oil prices did most of the damage. The message from the tape was narrow but pointed: investors are no longer treating the Treasury’s efforts to hold down borrowing costs as a durable fix, and long-dated debt resumed its slide.
The U.S. benchmark proxies all finished in the red at Thursday’s close, 20 Aug 2026 20:00 GMT. The SPDR S&P 500 ETF Trust (NYSEARCA: SPY) ended at $762.60, down 0.84% from the prior close of $769.06, and finished within a few cents of its session low of $762.04 — the sign of a market that sold into the bell rather than stabilising. The Invesco QQQ Trust (NASDAQ: QQQ), which tracks the Nasdaq 100, closed at $710.93, off 0.72%. The SPDR Dow Jones Industrial Average ETF Trust (NYSEARCA: DIA) took the worst of it, down 1.25% at $527.59 against a previous close of $534.27, a decline of $6.68 per share.
Why the Dow bore the brunt
The ordering of the losses is the useful detail. On a day driven by yields, the reflexive assumption is that long-duration technology names suffer most, because higher discount rates weigh hardest on cash flows that arrive years from now. Thursday inverted that: the Nasdaq 100 proxy fell least and the price-weighted Dow fell most, a spread of roughly half a percentage point between the two.
That pattern is more consistent with a rate move being read through the real economy than through valuation maths. The Dow’s constituents skew toward banks, industrials, retailers and healthcare — businesses whose customers and balance sheets feel a higher cost of money directly. A yield rise that also comes with climbing crude prices squeezes the same cohort twice: financing costs up, input costs up, and consumer discretionary income redirected to the fuel pump.
Oil’s contribution matters because it complicates the disinflation story that has underpinned equity multiples. Energy prices feed into headline inflation almost immediately and into expectations shortly after. When crude and long yields rise on the same session, the market is effectively pricing a higher floor under inflation and therefore a higher floor under policy rates — an unfriendly combination for anything valued off a long stream of future earnings, but an outright headwind for cyclicals now.
The Treasury’s cap is being tested
The specific reason yields resumed climbing, according to Bloomberg Markets, is that investors are betting the Treasury’s attempts to contain borrowing costs will provide only a temporary reprieve. That is a judgement about plumbing rather than about the economy, and it deserves unpacking.
A debt manager has levers over the shape of the curve without touching monetary policy. It can tilt issuance toward shorter maturities, so that less new supply lands in the ten- and thirty-year sectors where price sensitivity is greatest. It can adjust the size and cadence of auctions. It can buy back off-the-run securities to improve liquidity in the parts of the curve that matter for pricing. Each of these can compress long-end yields for a while.
What none of them changes is the total amount that has to be financed. Shifting issuance to bills does not reduce the borrowing requirement; it defers the maturity wall and increases the frequency with which the government must return to the market. Bond investors know this. So a Treasury-engineered dip in long yields tends to invite exactly the response markets delivered on Thursday: a probe to see whether the level holds without official help.
That is why the phrase “temporary reprieve” is doing so much work. It implies the marginal buyer of duration is not being paid enough yet, and that each administrative fix simply resets the starting point for the next leg of the selloff.
What the Asian handover looks like
Asian markets open into this without a fresh domestic catalyst. When a session in Tokyo, Sydney, Hong Kong or Seoul is set up by a U.S. yield move rather than by regional news, the pattern is usually mechanical: index futures gap lower at the open, exporters and rate-sensitive sectors lead the decline, and volumes are thin because there is nothing local to trade against.
Two regional transmission channels are worth watching. The first is currency. A rise in U.S. long yields widens rate differentials against most Asian sovereign curves, which pressures local currencies and can force domestic bond yields higher in sympathy — an imported tightening that no Asian central bank chose. The second is energy. Most large Asian economies are net crude importers, so a sustained move higher in oil is a direct hit to terms of trade and corporate margins, quite separate from the equity valuation effect.
The markers that decide whether this extends
For investors trying to work out whether Thursday was a one-session repricing or the start of something longer, the checkpoints are reasonably clear.
- Does the long end stabilise without intervention? If yields settle on their own, the Treasury’s approach earns credibility. If they need another administrative nudge, the market’s scepticism is validated.
- Auction demand. Bid-to-cover ratios and the share taken by indirect bidders at coming long-dated sales will show whether real money is stepping in at these levels or whether dealers are absorbing the supply.
- Whether oil’s move persists. A crude spike that fades is noise. One that holds forces a rethink of the inflation path and, with it, the terminal-rate assumption embedded in equity multiples.
- Sector leadership on the next up day. If cyclicals lead the bounce, the yield move is being read as growth-positive. If defensives lead, it is being read as a cost-of-capital problem.
- The Dow-Nasdaq spread. Thursday’s unusual ordering, with the Dow proxy down 1.25% against 0.72% for the Nasdaq 100 proxy, is a live indicator of whether this is a valuation story or an economy story.
For investors trying to work out whether Thursday was a one-session repricing or the start of something longer, the checkpoints are reasonably clear.
The broader context is that equity markets have spent an extended stretch tolerating higher-for-longer rates on the assumption that earnings growth, particularly from the large technology complex, would outrun the discount-rate drag. Thursday’s session did not overturn that assumption — sub-1% index declines rarely overturn anything. But it did show what the market does when the bond market’s confidence in official yield management cracks even slightly: it sells the parts of the index that live closest to the real cost of money, and it closes near the low.
Key facts
- S&P 500 ETF (SPY): $762.60 at the close, 20 Aug 2026 20:00 GMT, down 0.84%
- Dow ETF (DIA): $527.59, down 1.25% — the weakest of the three major proxies
- Nasdaq 100 ETF (QQQ): $710.93, down 0.72%
- Drivers cited: Climbing oil prices and benchmark bond yields; scepticism over Treasury borrowing-cost measures
Frequently asked questions
How much did U.S. stocks fall on Aug. 20, 2026?
At the close on Thursday, Aug. 20, 2026 (20:00 GMT), the SPDR S&P 500 ETF finished at $762.60, down 0.84% from the previous close of $769.06. The Invesco QQQ Trust, tracking the Nasdaq 100, ended at $710.93, down 0.72%. The SPDR Dow Jones Industrial Average ETF closed at $527.59, down 1.25%.
Why were Asian stocks set to open lower?
Asian markets were positioned to fall because the preceding U.S. session was weak, driven by climbing benchmark bond yields and higher oil prices. With no fresh regional catalyst, Asian indices typically take their opening direction from the U.S. handover, and both higher global yields and costlier crude are headwinds for net energy-importing Asian economies.
What are the Treasury’s efforts to contain borrowing costs?
A debt manager can influence the shape of the yield curve by tilting new issuance toward shorter maturities, adjusting auction sizes and timing, and buying back older securities to improve liquidity. These steps can lower long-dated yields temporarily, but they do not reduce the total amount the government must borrow, which is why investors treat the relief as provisional.
Why did the Dow fall more than the Nasdaq 100?
On a rising-yield day, technology usually suffers most because higher discount rates hurt distant cash flows. Thursday inverted that, with the Dow proxy down 1.25% against 0.72% for the Nasdaq 100 proxy. That ordering suggests the market read the yield and oil moves through the real economy — banks, industrials and retailers — rather than purely through valuation maths.
How does higher oil affect equity valuations?
Crude prices pass into headline inflation quickly and into inflation expectations soon after. When oil rises alongside long-dated bond yields, markets are effectively pricing a higher floor under both inflation and policy rates. That raises the discount rate applied to future earnings and simultaneously squeezes corporate input costs and consumer spending power.
What should investors watch next after this session?
Key markers include whether long-dated yields stabilise without further official intervention, demand metrics at upcoming Treasury auctions such as bid-to-cover ratios, whether the move higher in oil persists or fades, and which sectors lead on the next positive session — cyclicals would signal a growth read, defensives a cost-of-capital read.
Sources
- Asian Stocks Set to Fall as Bonds Resume Decline: Markets Wrap — Bloomberg Markets
Photo: Rafael Minguet Delgado · Pexels Licence — source